
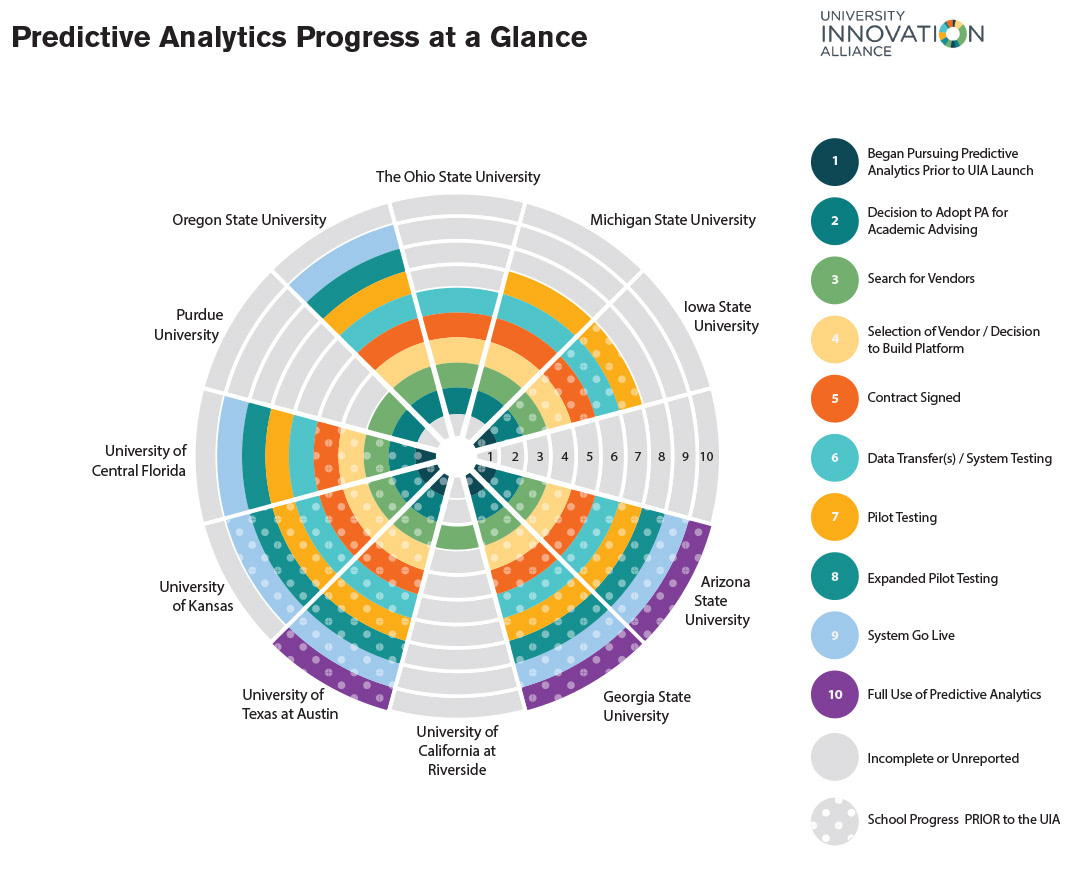
Purpose of project: Graphically depict participation of UIA schools as part of an annual report.
Constraints or parameters: Figure had to comply with UIA brand standards including typography and color pallet.
Constraints or parameters: Figure had to comply with UIA brand standards including typography and color pallet.
Process: Analyze brand standards, develop three comps, refine selected comp. Adobe Illustrator was the primary tool used.



Three diagrams illustrating the career paths of a professorship at ASU.
These graphics were part of the successful NSF ADVANCE proposal.
These graphics were part of the successful NSF ADVANCE proposal.
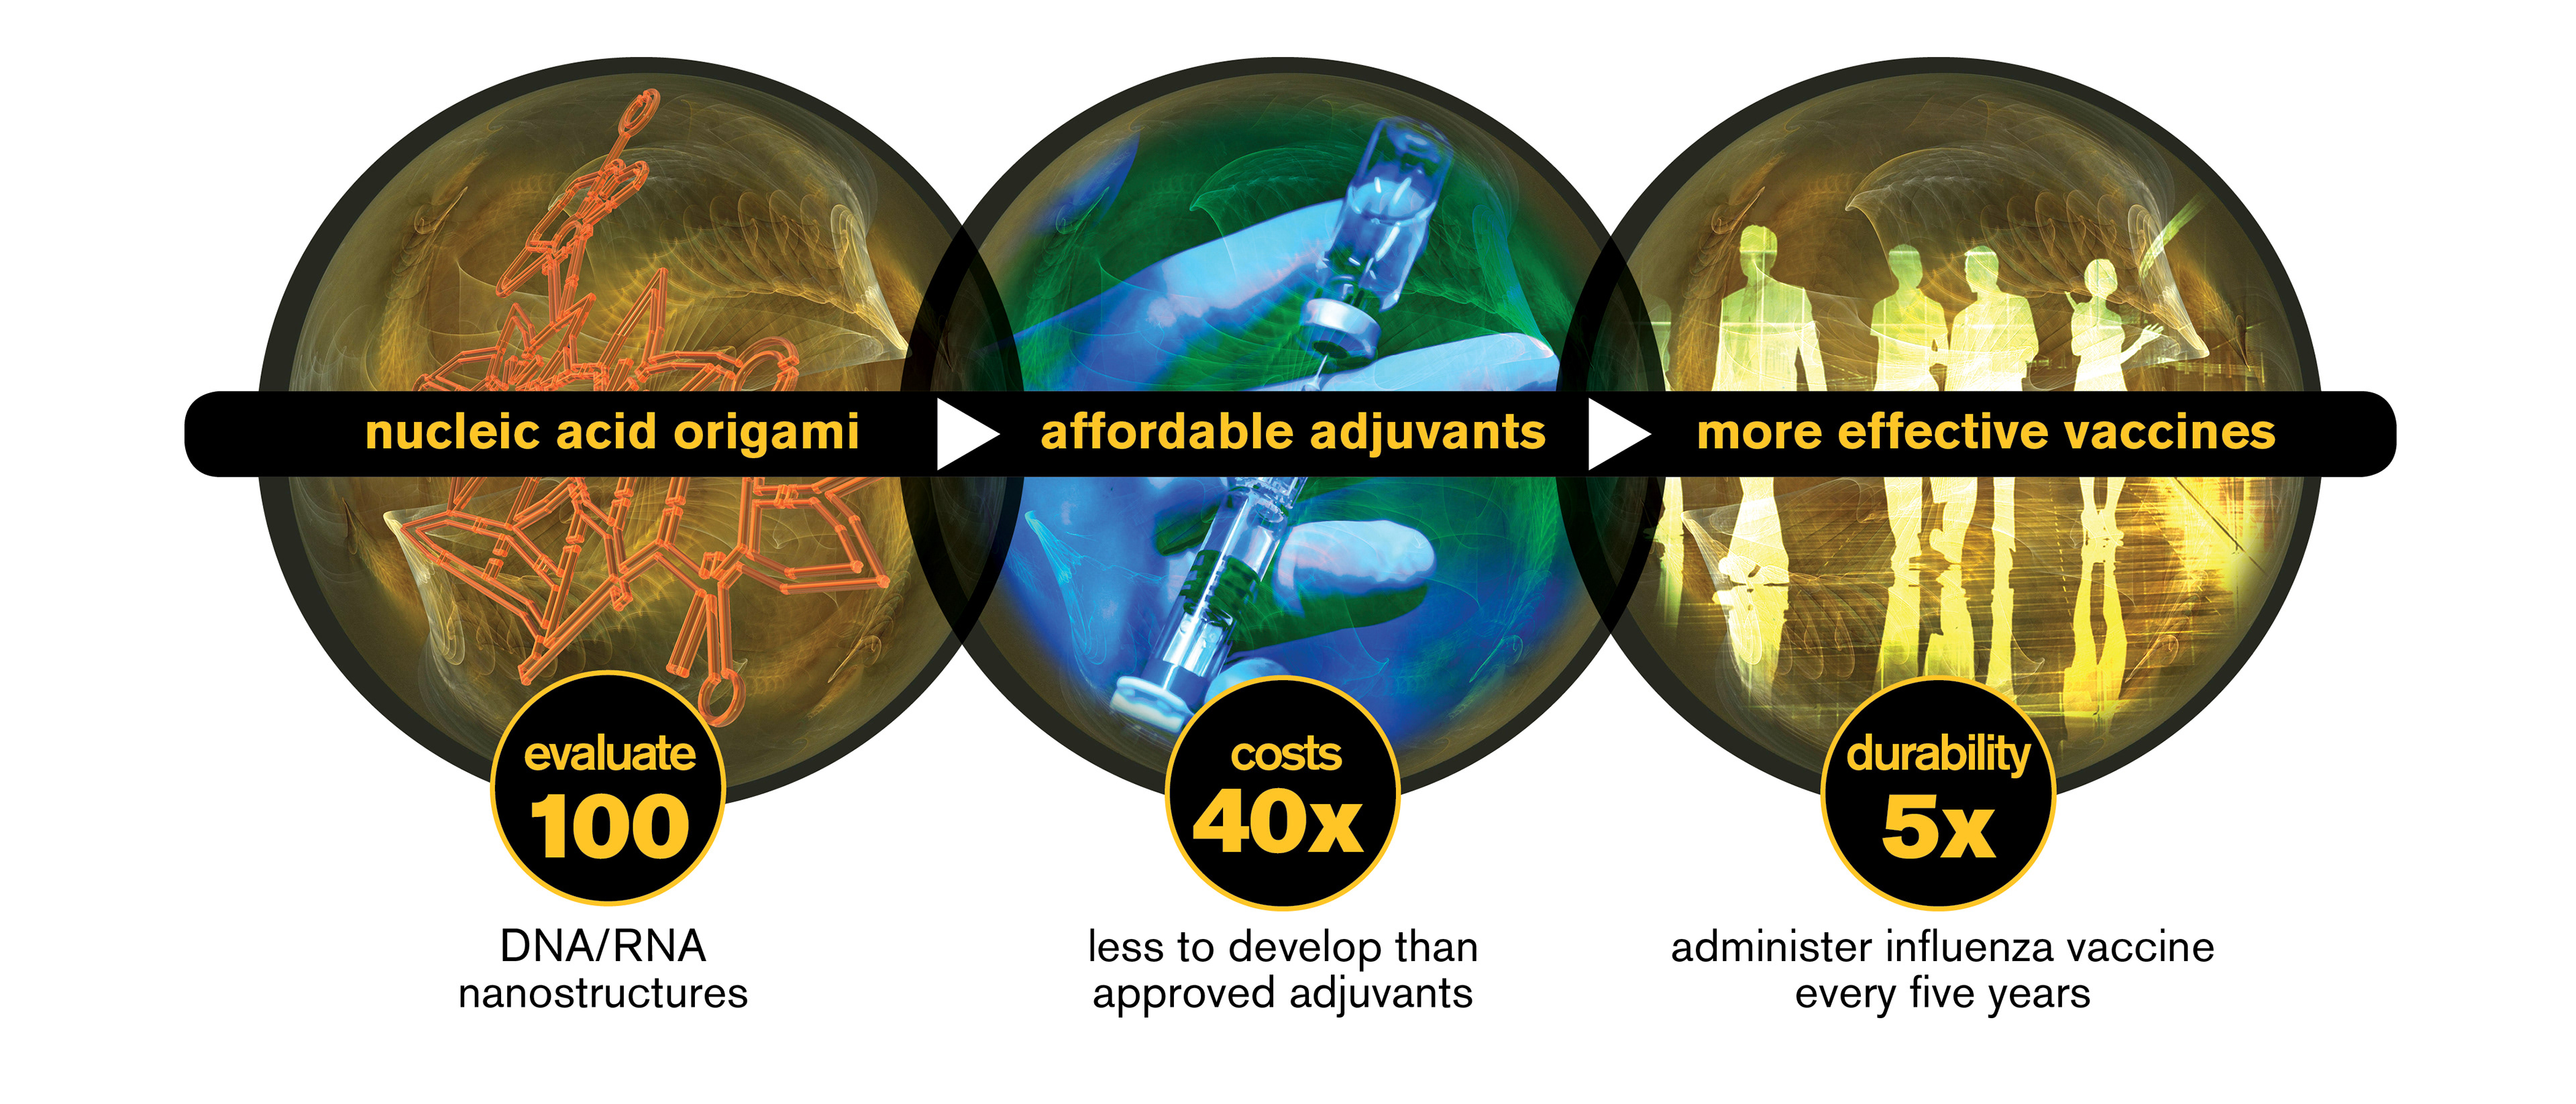
Summary graphic describing the aim of the proposal submitted to NIAID on behalf of Hao Yan, et. al
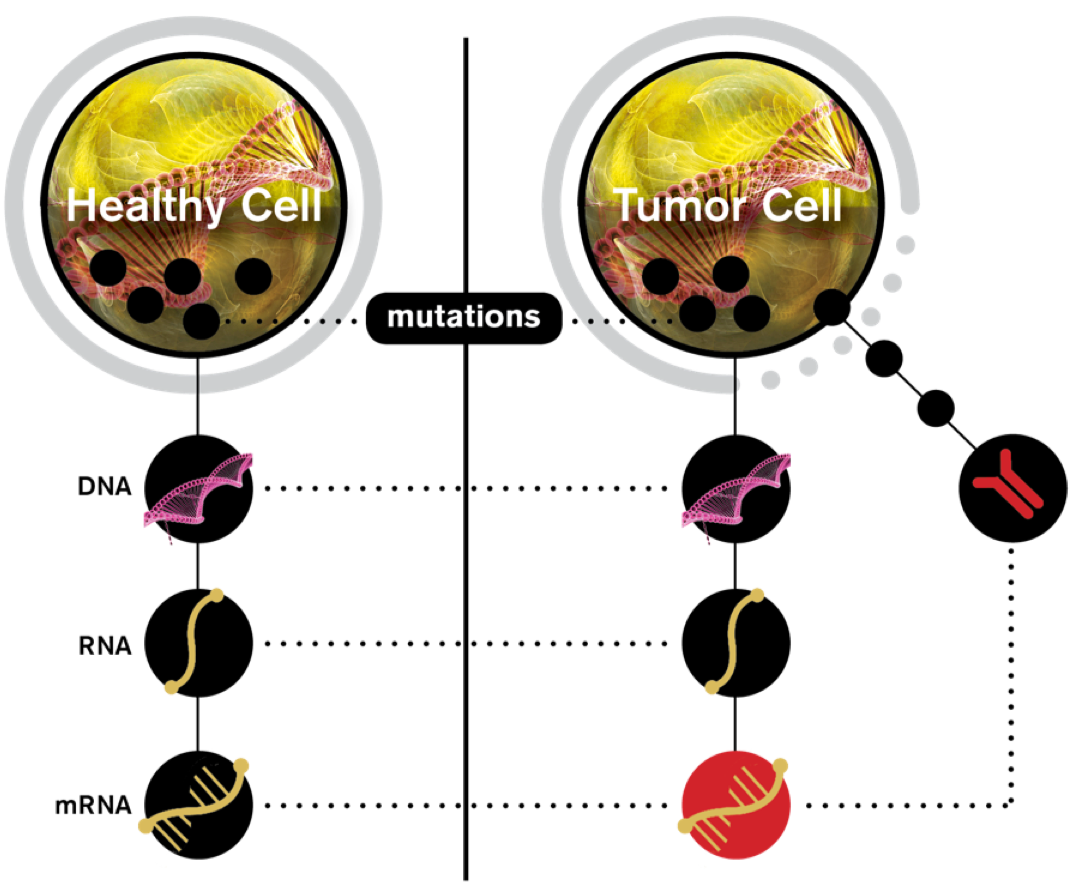
Diagram created for Dr. Stephen Johnston illustrating how cancer cells escape the cell lining and metastasize.